GfK webinar “New features in RegioGraph 2021”
Watch the recording and download a PDF overview!
Where are your target groups most concentrated? Where should you restructure your sales territories for improved efficiency? Where can you tap more market potential? Our new geomarketing software RegioGraph 2021 answers these and other “where” questions, giving you powerful tools for visualizing and analyzing your operations and markets on digital maps. Use these insights to make decisions with greater confidence and then communicate the results online with your team.
Watch the recording of our webinar “New features in RegioGraph 2021” from March 17, 2021 to find out more about the new features and most important applications of our software. In the webinar recording, you will get an overview of the following key topics:
- SALES TERRITORY PLANNING: Calculate your workload and set realistic goals.
Using the new calculation wizard you can determine the ideal workload of your sales force for customer visits. This provides you with a realistic basis to plan and optimize your targets. - DATA VISUALIZATION: Easily find the right parameters for your data analysis.
Solid data analysis will quickly give you the right answers. The newly integrated histogram helps you set the ideal value limits to achieve better informative value of your analyses. - LOCATION EVALUATION: Evaluate and compare locations using an individual benchmark score.
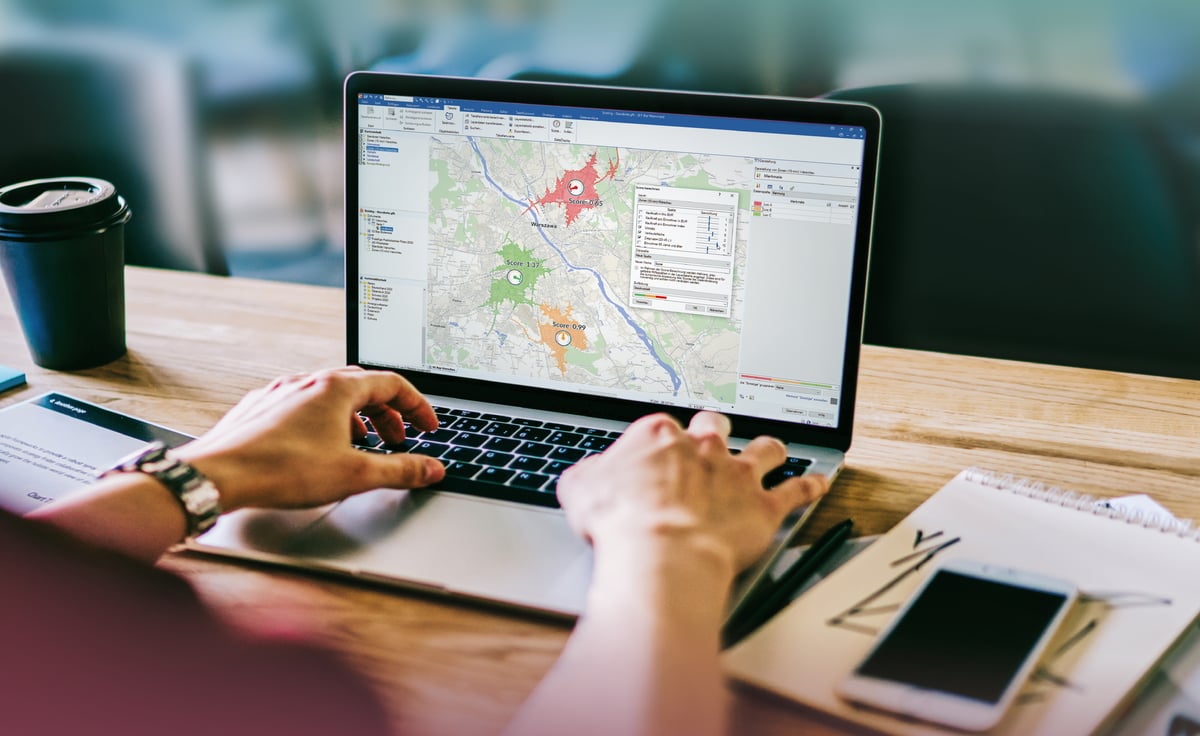
RegioGraph calculates a score based on your criteria and weighting. This allows you to compare the performance of your locations according to turnover, sales area and inhabitants in the catchment area.
